Video Conferencing with Solstice Performance Tool
Note
The following section assumes Enable Solstice Conferencing is turned on and configured both on the Solstice Pod and within your testing environment, as well as having the Solstice app and its Solstice Conference drivers installed on the laptop device being tested.
Overview
The Solstice Conferencing Performance tool is a standalone executable file for Windows 10 machines intended to assess a host laptop’s qualifications for successfully running Solstice video conferencing functions. Click here to download the application.
The Solstice Conferencing Performance application has four tabs:
System Information
When the Solstice Conferencing Performance tool is launched, the application runs an initial scan of the laptop device to evaluate system resources. The System Information tab shows the results of that initial scan and provides a rating along with an overall numerical score.
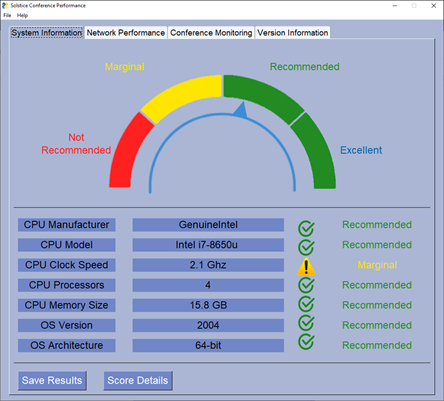
The following are the ratings and their definitions:
Not Recommended (Score: 0 - 25): The system is not recommended for use video conferences with Solstice.
Marginal (Score: 25 - 50): The system may not be capable of reliably running video conferences with Solstice.
Recommended (Score: 50 - 75): The system meets the recommended specs and should be able to reliably run video conferences Solstice.
Excellent (Score: 75 - 100): The system exceeds the recommended specs and has ample resources to run video conferences with Solstice.
The rating estimates the system’s performance if you were simultaneously running the Solstice app, Solstice conferenceing functionality, a video conferencing application such as Zoom or GoToMeeting, and other applications such as web browsers and standard productivity tools.
The bottom section of the System Information tab shows the individual components affecting performance and their individual rating. The Save Results button allows you to save a JSON file which contains the version information, results, calculated weights, etc. The Score Details button gives the numerical value for the laptop device’s overall score.
Network Performance
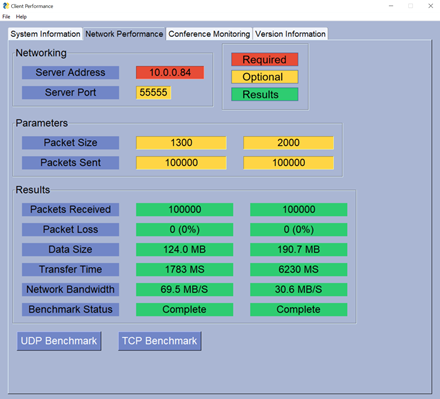
The Network Performance tab measures the speed of the network connection between the host laptop and the Solstice Pod. If a screen key is enabled for the Pod, you must enter the Pod’s valid screen key in the pop-up that appears, then click Submit to perform the test. To get the valid screen key, view the screen key on the Solstice Pod’s welcome screen display. If no screen key is enabled for the Pod, you can leave this field blank and simply click Submit.
Note
If you need to re-enter the screen key, you need to close the Solstice Conferencing Performance application, re-open the application, and then navigate back to the Network Performance tab.
Red indicates the field is required and that you need to input a value. Yellow fields indicate an optional parameter that you are able to change. Green fields show the results of the network performance test.
Before running, you need to set the Server Address (i.e. the Pod’s IP address) and update the Server Port field to the Pod's configured base communication port (e.g. 53100 by default). You can find the configured base port by opening the Solstice Dashboard, selecting the Pod from the list of Solstice instances, going to the Network tab > Communication Ports section, and locating the value in the Solstice Base Port field.
You also need to review the other optional fields. As a note, we recommend lowering the value for Packets Sent; however, the greater the quantity, the more accurate the test results are.
You may select to run the UDP Benchmark or TCP Benchmark tests. These are run independently, and the order they are run in does not matter. Results for the number of packets received and lost, data size, transfer time, and network bandwidth are listed.
Conference Monitoring
The Conference Monitoring tab provides CPU usage measurements for the Solstice app, Solstice video conference functions, and the Solstice virtual display.
Before you begin monitoring, you need to start a Solstice video conference session with the following:
Solstice app running
Video conference running and connected to Solstice
Solstice display (i.e. Screen 2) shared in the video conference
After the above Solstice conferencing session is running, select Start Monitoring and run through a working conference session to see how the system resources are used by the application. You may select Stop Monitoring at any time.
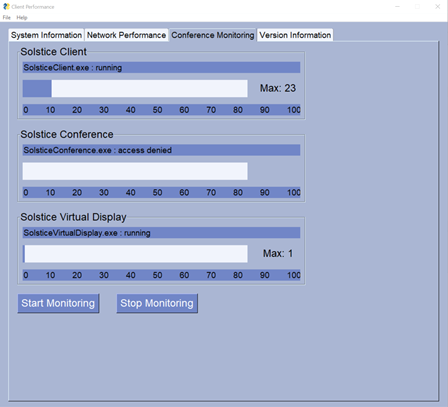
The scale is identical to the one used by the Windows Task Manager, so CPU usage is divided by the number of cores within the laptop’s processor. For example, a CPU usage reading of 10% indicates an average load of 10% across all cores.
Version Information
The Version Information tab provides information about the application’s release date and coinciding Solstice release as well as applicable copyright information.