Monitoring Analytics Tab
On the Analytics page, the monitoring tab displays metrics that are pre-calculated every night from the raw events data for each organization, and the charts will display the data up to yesterday’s date.
There is a time frame selector with five options: last 7 days, 30 days, 60 days, 90 days, and All time. By default, the last 7 days are selected, and users can change it to other time frames. When the user changes the time frame, all visuals on the page should update to include the data in that time frame.
Downtime
This section includes two metrics that illustrate device downtime.
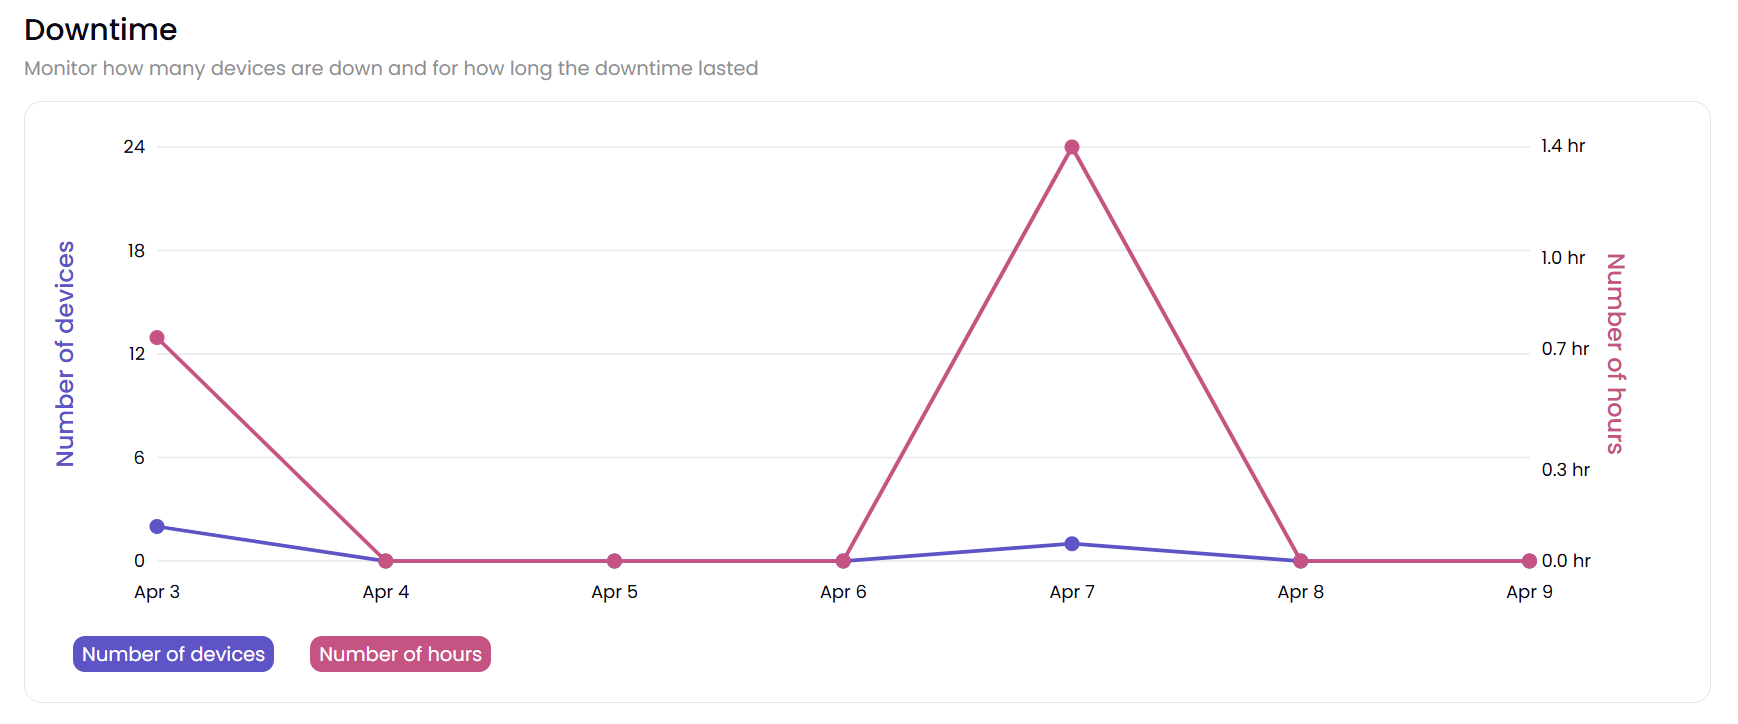
Number of devices: The number of devices that were offline for longer than 30 seconds in a day. If a device went offline and never came back online, it is not considered here.
Number of hours: The total offline hours (time between going offline and going online again) across all devices by day. If a device went offline and never came back online, it is not considered here.
Alerts
This section has two metrics for alerts.
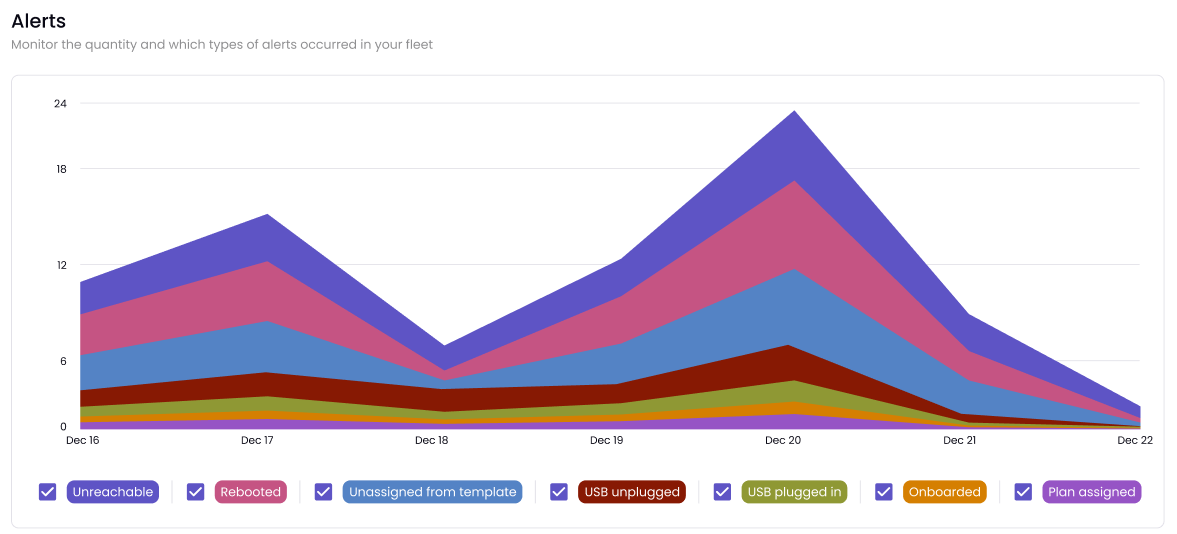
Unreachable: The total number of times that devices went offline for longer than 30 seconds each day.
Rebooted: The total number of times devices were rebooted each day.
Unassigned from template: Look for this in an upcoming release.
USB unplugged: Look for this in an upcoming release.
Onboarded: Look for this in an upcoming release.
Plan assigned: Look for this in an upcoming release.
Selected Devices
This table summarizes a table visual showing total downtime, unreachable, and rebooted by device statuses. Selecting or deselecting a device here should filter/unfilter the device’s data from all the charts above this section.
Note
This page has an “Export to CSV” button that exports the data in the tabular visual in the Selected Devices section into a CSV file. If there’s no data to export, then this button will be disabled.