Home Page
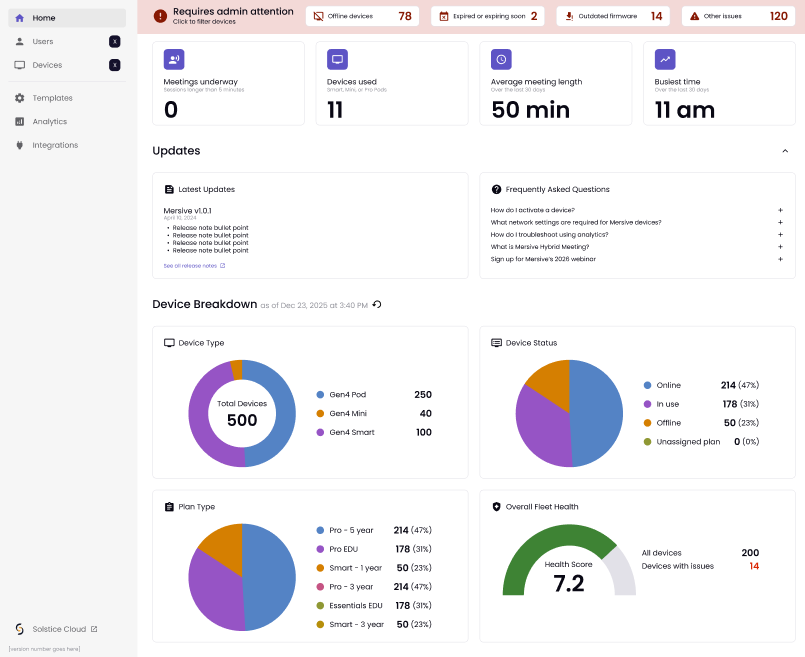
The Admin home page contains charts that display useful monitoring data for administrators.
Red Alert Ribbon
On the home page, the red alert ribbon displays alerts to the Admin when pods require attention and is only visible when there are current metrics.
Offline devices: The number of devices that are offline.
Expired or expiring soon: The number of devices whose subscription is either expired or about to expire within 30 days.
Outdated firmware: Look for this in an upcoming release.
Other issues: Look for this in an upcoming release.
Summary
Immediately under the red ribbon alerts are four summary metrics:
Meetings underway: This number shows how many meetings are currently in progress.
Devices used: The number of devices that were used at any point in the past 30 days.
Average meeting length: The average duration of meetings in the last 30 days that lasted longer than 5 minutes. If the value is less than 60 minutes, it displays the minutes with no decimal places; if the value is 60 minutes or more, it displays the hours with up to 2 decimal places.
Busiest time: The hour of the day where the largest number of meetings occurred in the last 30 days.
Updates
The Updates section displays the most recent release notes, along with some frequently asked questions.
Device Breakdown
There are four metrics in this section that provide an overview of the organization’s fleet of activated devices.
Device Type: This pie chart shows the fleet split by Pod, Mini, and Smart devices.
Device Status: This pie chart shows the fleet split between online and offline devices.
Plan Type: This pie chart shows the fleet split by licenses.
Overall Fleet Health: This is a custom measure that ranges from 0 to 10, calculated as (Total devices - Devices with issues) / (Total devices) * 10, rounded to 1 decimal place. Devices with issues are offline devices and devices that are expired or expiring soon.